You can connect Microsoft® Excel® directly to the Agility Blue API using Excel's Power Query feature. This allows you to extract and visualize data using all of the power that Excel has to offer. Additionally, exporting large sets of data that exceeds the API's record limit per page is much more efficient using Excel over manually exporting pages of data through Agility Blue grids.
As of the time of this writing, the Power Query functionality described in this article pertains to the Microsoft Windows version of Excel only, specifically the Microsoft 365 MSO (2206 Build 16.0.15330.20246) version or higher.
Connecting the Data Source
You will need:
- Your Agility Blue base api url,
- Your Agility Blue API key, and
- Your Agility Blue Workspace Id
To locate your base api url and workspace id, log into Agility Blue, enter your workspace, and click on the user drop down menu (top-right, displaying your initials). From the menu, select the "About" menu item. Locate and take note of the "Base API URL" value and the "Workspace Id" value.
If you don't already have an Agility Blue API Key, follow the steps outlined in this article.
Open Excel, and create a new blank workbook. Click on the "Data" tab on the ribbon bar, click the "Get Data" button on the "Get & Transform Data" group. From the drop down, navigate to the "From Other Sources" option, and select the "From Web" menu item.
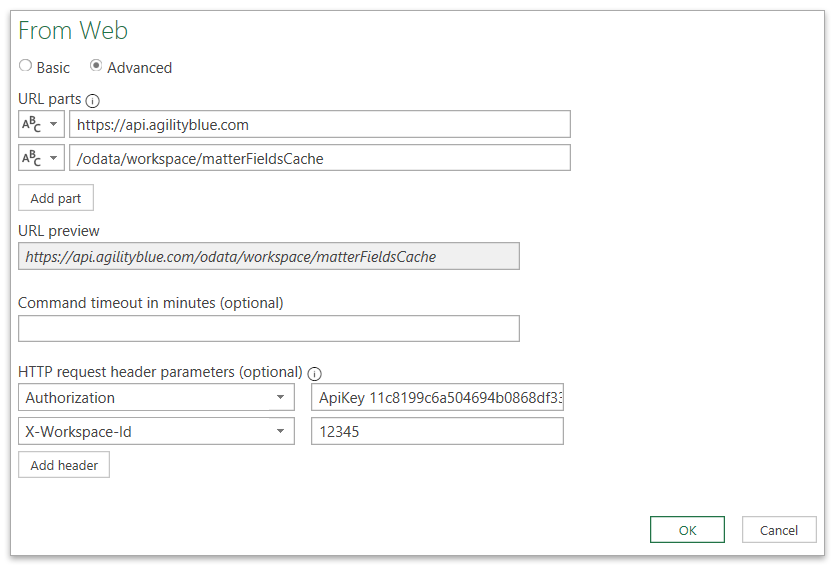
Select the "Advanced" radio button and fill out the following information:
- URL parts (1): Enter your base api url
- URL parts (2): Enter a resource path, for example "/odata/workspace/matterFieldsCache" to retrieve a flattened list of matters that include custom fields. For more information on available resource paths, take a look at the api documentation.
- HTTP request header parameters (1): Enter "Authorization" into the drop down list (you will likely need to manually type this if the option doesn't exist), and type in "ApiKey " followed by your api key as the value (don't forget a space between "ApiKey" and your api key!).
- HTTP request header parameters (2): Enter "X-Workspace-Id" into the drop down list and type in your workspace number as the value.
Click the OK button and after Excel connects to the API, you should be presented with the Power Query editor that shows 2 records of a JSON document:

The Agility Blue API provides documents in JSON format that adhere to resource models. Collection endpoints, such as this example using the matterFieldsCache endpoint, provide a JSON document with a "value" array that holds a collection of JSON documents. In this example, each matter record is a single JSON document.
At this point, you've made a successful connection to the API and now you need to model the resulting JSON documents list into a table for Excel to consume.
Simple Data Modeling
To convert the list of JSON documents to a table, follow the following instructions:
- On the second record, the one titled "value", click on the "List" hyperlink.
- The list will expand out to show all of the JSON document records within the list and applies a "Navigation" step on the right-hand query settings panel.
- At the top, on the ribbon toolbar, make sure that the "Transform" tab is selected and click on the "To Table" button in the "Convert" group.
- You will be presented with a window that provides options for converting a list of values to a table. Keep the defaults and click on the OK button.
- It may not look like much happened, but you now have a table of values instead of a list of values. Your column will be named "Column1" and right next to the column name will be a button that shows two arrows appearing to expand outwards. Click on this button.
- You should now see a list of available fields for your workspace's matter object. If you scroll down the list, and you have custom fields, you will notice that they will be named with CF_ followed by the custom field id.
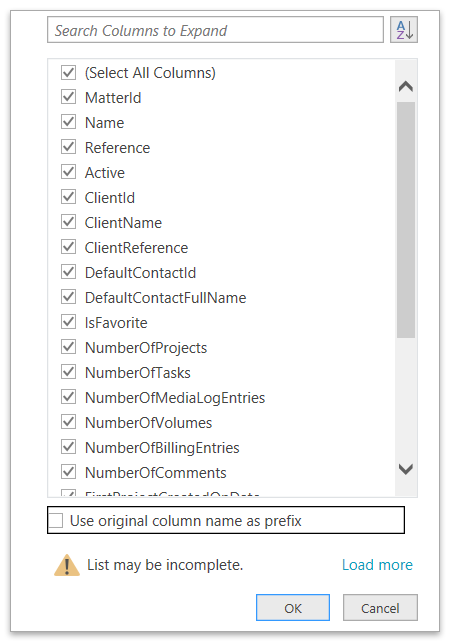
- Unselect the option "Use original column name as prefix" and hit the OK button.
At this point, you will have a preview of your matters with all of the matter columns as the API provides them. You have an opportunity now to do some additional modeling and cleanup prior to importing the data directly into an Excel sheet.
We recommend:
- Updating the column names. The column names are what we call "camel-cased", where the separation of words is indicated by capital letters within a single word. You should consider quickly renaming the columns by double clicking on the column header and adding spaces or phrasing you'd like.
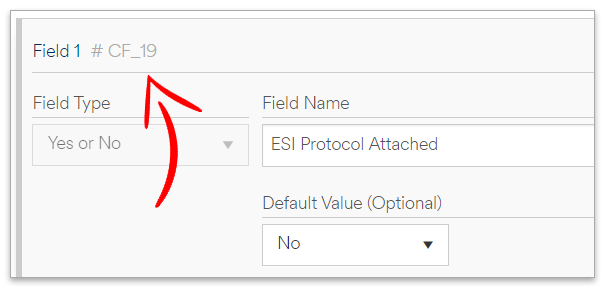
- Custom field columns names. As indicated earlier, custom fields are named CF_{FieldId}. If you head into Agility Blue and go into edit mode on any object, you will notice that "CF_{FieldId}" is displayed on each field indicating that field's id. You should consider renaming these CF_{FieldId} column names to their appropriate field labels.
- Change data types. By default, Power Query will assume everything is a general data type, indicated by the "123|ABC" icon to the left of each column name. We suggest going through the columns, clicking on those icons, and selecting the appropriate data type - particularly date/time/timzone for dates, true/false for booleans, and the correct number type for numbers.
You can explore more column modeling capabilities by locating the Power Query documentation.
Importing the Query Table
When you're finished with modeling the data, click on the "Home" tab and click on the "Close & Load" button.
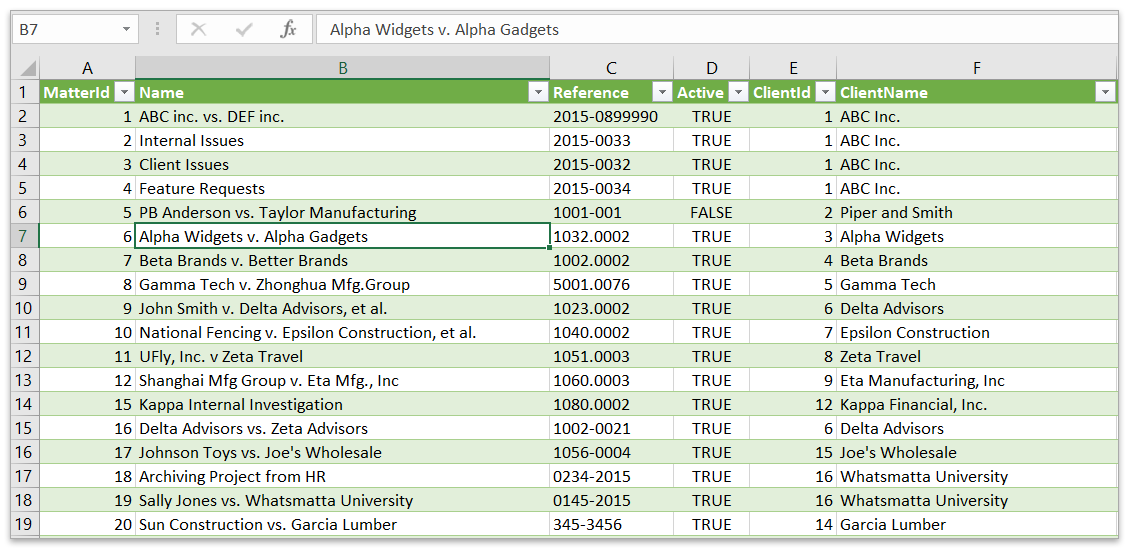
Your table data will be imported into a new sheet and you can now begin using Excel's tools to start manipulating and/or visualizing the data further. Because you used a Power Query to import the data, there is no need to repeat the steps to get the data as you can always refresh to get the latest data by clicking on the "Query" tab on the ribbon toolbar, and clicking on the "Refresh" button. If there was new data added to Agility Blue since the last time you imported data, any modified or new records will appear within your sheet.
If you ever want to edit or build onto your query any further, while still on the "Query" tab, click on the "Edit" button and it will take you back into the Power Query editor.
Paging Through Data
If the amount of data returned from the API has hit the 1,000 record limit, you will need to consider a paging strategy to get all of the data. This can be done manually by creating multiple queries and merging them together into one, or it can be done automatically by adjusting the process to crawl the necessary queries.
Consider filtering your data when possible to avoid unnecessary paging. You can apply filtering by adding the $filter parameter to your url.
In order to page data, you need to include the $top and $skip query parameters in the request. For example, if you only want to return pages of 50 records at a time from the API, but anticipate having more than 50 records total, you would use a $top value of 50, and provide a $skip value equal to the page index multiplied by the $top value depending on which page you'd like to view. The page index is 0-based (starts at 0).
For example, to retrieve the first 50 records (page index 0), you would include in your request ($skip = 0 * 50 = 0):
$top=50&$skip=0
And to get the 2nd page (page index 1) ($skip = 1 * 50 = 50)
$top=50&$skip=50
Manual Pagination Approach
You will create a query for each page of data needed, and then merge those queries into one query at the end.
First, follow the initial steps outlined in the connecting the data source section and return back here when finished.
Update the web contents url within the formula bar to include the $top and $skip parameters. We will use an example of returning 10 records per page, so our initial query will have 10 as the value for $top and 0 for the value of $skip. We will also add the $count parameter so that we know how many total records there are, and thus how many pages (queries) we will end up needing.
"https://api.agilityblue.com" & "/odata/workspace/matterFieldsCache" & "?$count=true" & "&$top=10" & "&$skip=0"
You will notice now that 3 records return instead of 2, now including the @odata.count

Continue on with the simple data modeling section and return back here when finished.
We now know that we will need a total of 6 queries to get all 60 records using our example of 10 records per page.
- In the Queries section, rename the first query to
matterFieldsCache (Page 1). - Right click on the query and select the "Duplicate" menu item and rename this new query to
matterFieldsCache (Page 2). - In the new duplicated query, on the right-hand Query Settings panel, click on the first step labeled "Source".
- Update the
$skipparameter to10. This will ask the API to return 10 records starting at index 10, the second page of records. - Repeat the steps until you have all the pages you'd like to merge.
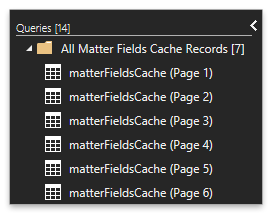
Right-click within the Queries panel and move down into the "New Query" menu heading, then to the "Combine" and select the "Append Queries as New" menu item.
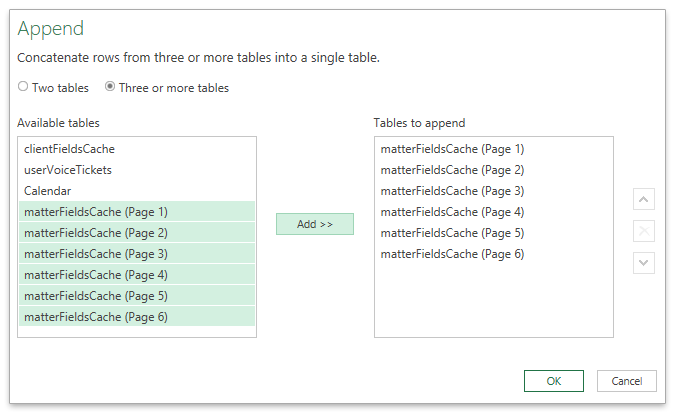
Select the "Three or more tables" radio button, highlight all of the queries you just created, and click the "Add >>" button to add the queries to the "Tables to append" section. Click the OK button.
You will end up with a single table of all of your queries combined. From here, you can do additional modeling, or import the results into a new sheet.
Automatic Pagination Approach
Manual pagination may be a simpler approach for situations where there are a few pages of data or you just need to get a snapshot of your data quickly. However, the manual process can present a few problems. For example, as your data grows, you need to account for additional pages. Also, what if you have 100,000 records? That's a lot of queries to have to create manually!
The automatic pagination approach described here will solve the above issues by creating the list of queries and running them all for you, so you don't need to worry about how many pages or additional queries you'd need - it does this all within just one query and a few parameters.
First, follow the initial steps outlined in the connecting the data source section and return back here when finished.
Update the web contents url within the formula bar to include the $top and $skip parameters. We will use an example of returning 10 records per page, so our initial query will have 10 as the value for $top and 0 for the value of $skip. We will also add the $count parameter so that we know how many total records there are, and thus how many pages (queries) we will end up needing.
"https://api.agilityblue.com" & "/odata/workspace/matterFieldsCache" & "?$count=true" & "&$top=10" & "&$skip=0"
You will notice now that 3 records return instead of 2, now including the @odata.count

On the top ribbon toolbar, make sure that the "Home" tab is selected and click on the "Manage Parameters" button within the "Paramaters" group.
Click on "New" to create a new parameter with the following settings:
- Name: RecordsPerPage
- Required: Selected
- Type: Any
- Suggested Values: Any value
- Current Value: 10
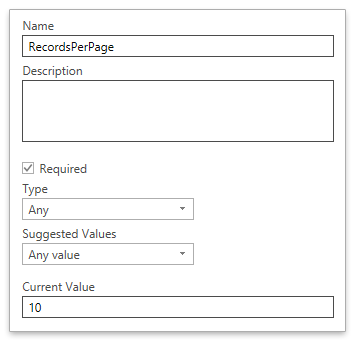
The "Current Value" will represent how many records per page we would like to retrieve from the API. In our example here, we are using 10 for illustrative purposes, but in reality, you will likely want to set this to a higher number like 1000, since that will produce less round trips with the API.
If you try to set the $top parameter, or the "RecordsPerPage" current value, to a number higher than 1,000, the API will return an error.
Select your query to go back to editing it, right-click on the @odata.count cell and choose the "Drill Down" menu item. This will produce a new step that shows the total records count as a single value.
From the top ribbon toolbar, select the "Home" tab and click on the "Advanced Editor" button within the "Query" group.
Rename the last query within the advanced editor by changing the line #"@odata count" = Source[#"@odata.count"] to #"TotalRecords" = Source[#"@odata.count"].
Add a new line below the last query: "ListPages" = List.Numbers(0, Number.RoundUp(#"TotalRecords" / #"RecordsPerPage"), #"RecordsPerPage") and change the last line from @odata count to #"ListPages". Your query should something like this:
let
    Source = Json.Document(Web.Contents("{your_base_api_url}" & "/odata/workspace/matterFieldsCache" & "?$count=true" & "&$top=10" & "&$skip=0", [Headers=[Authorization="ApiKey {your_api_key}", #"X-Workspace-Id"="{your_workspace_id}"]])),
    #"TotalRecords" = Source[#"@odata.count"],
    #"ListPages" = List.Numbers(0, Number.RoundUp(#"TotalRecords" / #"RecordsPerPage"), #"RecordsPerPage")
in
    #"ListPages"
Click the Done button. You will end up with a list of values that will make up however many queries will be needed to get all of the data where each value represents the $skip value needed for each query.
From the top ribbon toolbar, select the special "Transform" tab under the upper "List Tools" tab (this should be the last tab). Click on the "To Table" button within the "Convert" group. Keep the defaults of the "To Table" window, and click the OK button.
We now have a table of $skip values. Rename the Column1 column to PageSkipValue and change the column type to text by clicking on the "ABC|123" icon to the left of the column name and selecting the "Text" menu item.

On the right-side panel, under Query Settings, click on the first step (likely titled "Source"). Copy the contents of the formula into your clipboard, and then click on the last step under query settings (likely titled "Changed Type"). From the top ribbon toolbar, select the "Add Column" tab and click on the "Custom Column" button within the "General" group.
Paste the contents of your clipboard into the "Custom Column Formula" box. Remove the extra "=" at the beginning, and update the url so that the $count parameter is removed, and the $top and $skip values are now grabbing the variables that you created instead of the previous hard-coded values. It should be similar to the following (be sure to use your own values where indicated):
Json.Document(Web.Contents("{your_base_api_url}" & "/odata/workspace/matterFieldsCache" & "?$top=" & Number.ToText(#"RecordsPerPage") & "&$skip=" &[PageSkipValue], [Headers=[Authorization="ApiKey {your_api_key}", #"X-Workspace-Id"="{your_workspace_id}"]]))
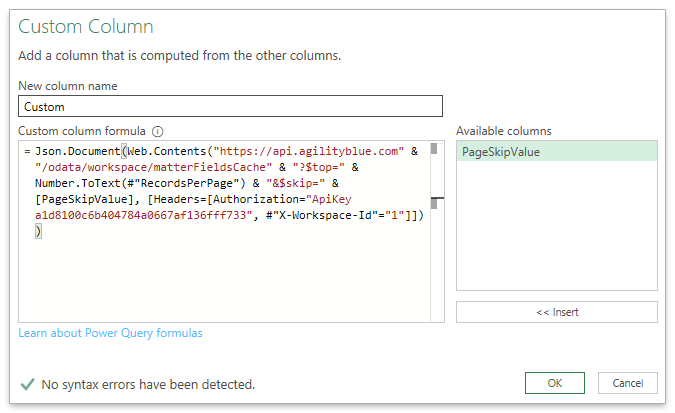
After clicking on the OK button, you will see a new column in your table called "Custom" with a hyperlink named "Record" in each cell. To the right of the "Custom" column name, you will see a button with what appears to be two arrows pointing outward (called the "Expand" button). Click this button. Make sure that only "value" is selected in the popup window, unselect the "Use original column name as prefix" option and click the OK button.
The "Custom" column will now be named "value" and you will see the word "List" in each cell instead of "Record". Click the expand button for the value column now and choose the "Expand to new rows" menu option.
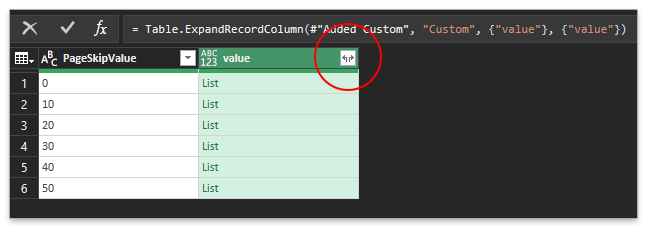
After expanding to new rows, you will now see a list of all the records for every page (60 records in this example). If you click on the expand button one more time on the value column, you will now get the picklist for selecting the desired columns. From this point you can continue following along in the simple data modeling section.
You can now automatically grab all pages of data as needed any time you refresh the data.